What Does Body Fat Percentage Actually Look Like? The Pictures Online Are Mostly Lying
Roughly: 10-14% shows visible ab separation, 15-19% is lean with abs that need a flex, 20-24% looks like a normal fit person, and 25-29% is a softer but still healthy range — add about 8-12 points to each for women, since essential fat levels differ. Lighting, hydration, and pose can shift how any of these actually looks by several points, which is why photo comparisons vary so much.
 Written by Brooke Tanner
· July 22, 2026
Written by Brooke Tanner
· July 22, 2026
I spent a weekend doing something a little unhinged: reading through years of r/Fitness and r/bodybuilding threads where people posted a photo and asked "what body fat % is this," then cross-checking the guesses against people who'd actually gotten a DEXA scan or a hydrostatic dunk within a few weeks of the photo. The gap between what strangers guessed and what the scan said was bigger and weirder than I expected — and it explained something that's been bugging me about basically every "body fat percentage pictures" page that ranks on Google: they're almost all stock photos of fitness models at the exact same lighting and pump, relabeled with different numbers. That's not what 20% body fat looks like on you, in your bathroom mirror, on a Tuesday.
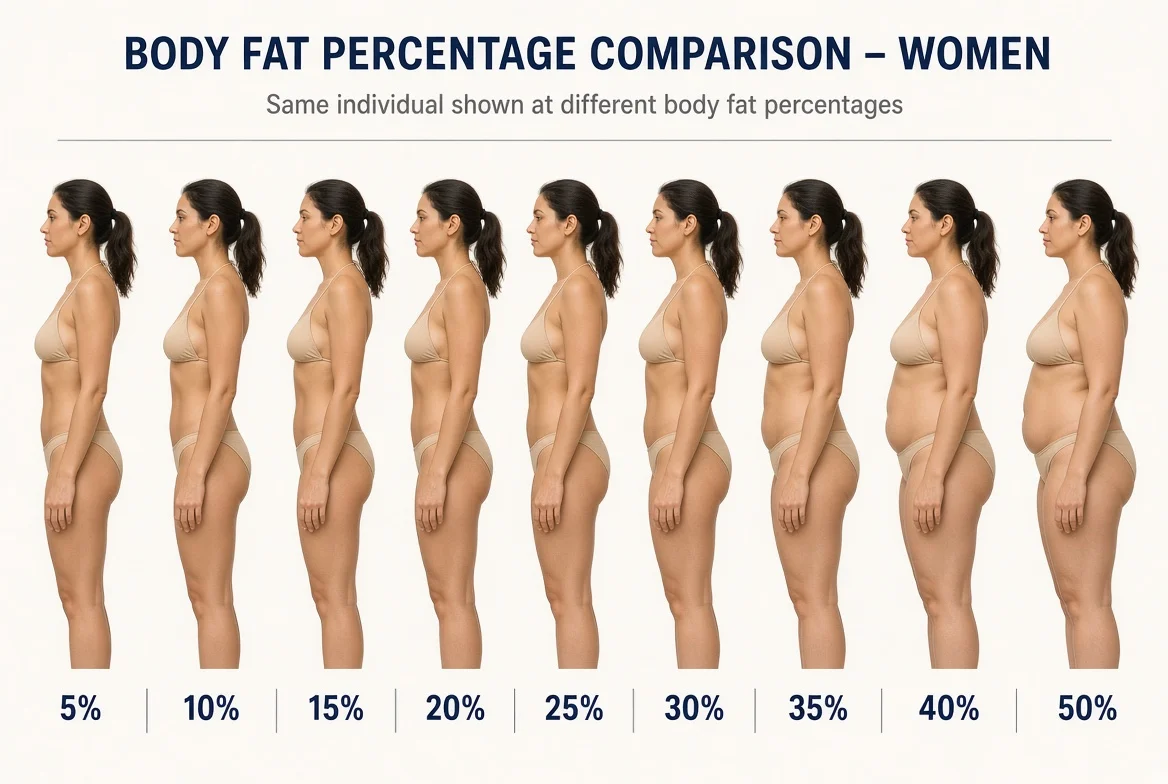
So here's an actual breakdown, range by range, with the honest caveat that "looks like" is doing a lot of work in that sentence — more on why below.
There's a specific pattern in those threads worth calling out before the numbers: for every person who posts a photo insisting they're at 12% and gets told by three separate commenters they're closer to 18-19%, there's someone else at the actual 12% who's convinced they still look "kind of fat" because they're comparing themselves to a shredded stage photo, not a real person. Almost nobody is a good judge of their own body fat from the inside — you know where you're insecure, so you either round down out of hope or round up out of habit, and neither has much to do with what a scan would say.
| Body fat % | Typical look (men) | Typical look (women) |
|---|---|---|
| 10-14% | Visible ab separation, vascularity | Very lean, athletic, defined — competition-adjacent |
| 15-19% | Lean, defined shoulders/arms, abs need a flex | Toned and athletic, some ab definition |
| 20-24% | Healthy, fit-looking, slight softness over abs | Lean and shapely, the common "fit" look |
| 25-29% | Softer midsection, less muscle separation | Athletic with some softness, still a normal healthy range |
| 30%+ | Noticeably less definition throughout | Softer overall, still within a common, non-extreme range |
Treat that table like a weather forecast, not a property deed — directionally right, not something to hold anyone to the decimal point on.
What 10% Body Fat Looks Like
Visible ab separation shows up here — genetics decide exactly when (some guys have it at 13%, others don't until 10%, down to where your ab muscles' tendinous insertions sit), but the range itself is real. Vascularity in the arms and lower abs shows up around here too. And I'll say the part most "how to get shredded" content skips: this isn't a number to chase year-round. Competitive bodybuilders diet down to it for a show and can't hold it more than a few weeks. It's a stage look, not a lifestyle.
What 15% Body Fat Looks Like
Lean, athletic, visible muscle separation in the shoulders and arms, but abs are more "there if you flex and the light's right" than "there in a t-shirt." This is genuinely the range a lot of consistently active people who lift and watch what they eat land in without doing anything extreme — it's a realistic, sustainable target in a way 10% mostly isn't.
What 20% Body Fat Looks Like
This is the one people search for most, and it's also the most misunderstood range on this whole list. At 20%, most men look like a normal fit person in clothes — not lean, not soft, just healthy-looking. Shirtless, there's usually a slight layer over the abs with maybe a hint of the upper two showing under good lighting, and definition in the arms and shoulders holds up fine. If you've seen a "before" photo in a transformation post that still looks reasonably put-together, it was probably shot around here, not at 30%+.
This is also the range where the recent wave of "I fed my photo to ChatGPT and asked for my body fat %" posts tend to land, and it's worth a quick word on why those are hit-or-miss: a general-purpose AI model wasn't built or instructed to account for lighting, pose, or camera angle the way a purpose-built estimator can be — ask the same model to guess twice from two photos of the same person in different light and you'll often get two different numbers. That's not a knock on AI estimation as a category, it's specifically a "know what the tool was actually designed to correct for" problem.
What 25% Body Fat Looks Like
Softer through the midsection, less visible muscle separation, but this is not "overweight-looking" the way a lot of online body fat charts imply — it's genuinely within a normal, healthy range and is where plenty of regular gymgoers who lift a few times a week but don't track food closely actually sit. The visual jump from 20% to 25% reads as more noticeable than the jump from 15% to 20%, mostly because that's where waist definition starts disappearing.
Why Women's Numbers Look Completely Different at the Same Percentage
If you've ever seen a "25% body fat" comparison photo of a man next to one of a woman and thought they didn't look remotely similar, you weren't imagining it — essential fat alone (the fat your body needs to function, tied to hormone production) runs about 8-12% higher for women than men, so the ranges don't line up on a shared scale the way most charts imply. 25% on a woman reads as lean and athletic with visible shape and muscle tone — it's a completely normal number for a regular yoga instructor or recreational runner, not a "needs to lose weight" number the way some clickbait comparison charts frame it. A lot of women searching "body fat percentage pictures" are comparing themselves against a man's chart without realizing the numbers were never supposed to line up 1:1.
Why the Photo You're Comparing Yourself To Is Probably Lying
Here's the part that actually matters more than any individual number. Photo-based body fat estimates — whether it's you eyeballing a chart, a friend guessing, or an AI tool analyzing a photo — typically land within about ±3-5% of a real scan under good conditions, and worse than that under bad ones. Lighting is the biggest offender: harsh overhead light or a strong side light creates shadow definition that reads as several points leaner than reality, which is exactly why gym-mirror "cut" photos and bathroom "bloated" photos of the same person a few hours apart can look like two different body fat percentages. Hydration status alone can shift how defined someone looks day to day, water retention can hide real definition for a day or two, and a braced, sucked-in pose reads noticeably leaner than a relaxed stance. None of that shows up in a static comparison chart. So stop matching your reflection to one like it's a paint swatch — it was never built to be that precise, and holding yourself to it is a great way to feel worse about a body that's actually fine.
So What's Actually Worth Doing
Comparing yourself to a stock photo chart tells you almost nothing useful, because you don't know what lighting, pose, or pump that photo was shot under. What actually works is tracking your own physique consistently — same lighting, same pose, same time of day — so you're comparing yourself to yourself, not to a fitness model's best-lit gym-mirror shot. If you want a same-day estimate to start from, our Body Fat Percentage Calculator gives you a free, instant read from one photo, accounting for the lighting and pose distortions above rather than taking the image at face value. It's not a DEXA scan, and it won't pretend to be one — but it's a much more honest starting point than matching your reflection to a decade-old stock photo grid.
Frequently Asked Questions
Stop wondering — find out now
Body Fat Calculator is free, private, and instant — no account, no public post, no waiting.
Get My ResultMore Body Analysis Tools
Genetic Muscle Potential Calculator
Upload a photo (plus height/weight) and estimate your natural genetic muscle-building potential with AI. Free and instant.
See your result — freeFFMI Calculator
Calculate your Fat-Free Mass Index (FFMI) with an AI-assisted photo estimate plus height and weight. Free and instant.
See your result — freeHow's My Posture?
Upload a side-profile photo and let AI analyze your posture — spine alignment, shoulder position, and forward head posture. Free and instant.
See your result — free